Salon owners — let's simplify something that often feels overwhelming but is actually your biggest growth advantage: Google Analytics (GA4).
Here's a hard truth: most salons don't struggle because of a lack of demand. They struggle because they don't know what's actually working.
- Where are your best clients finding you?
- What exactly makes them click "Book Now"?
- Why do some clients return while others vanish?
Google Analytics answers all of these questions with absolute clarity. Think of GA4 as your digital front desk — but infinitely smarter. Instead of guessing your next move, you can make data-backed decisions that drive real revenue.
Below are the 12 reports that actually matter for a salon business. No fluff, no confusion.

1. User Acquisition Report
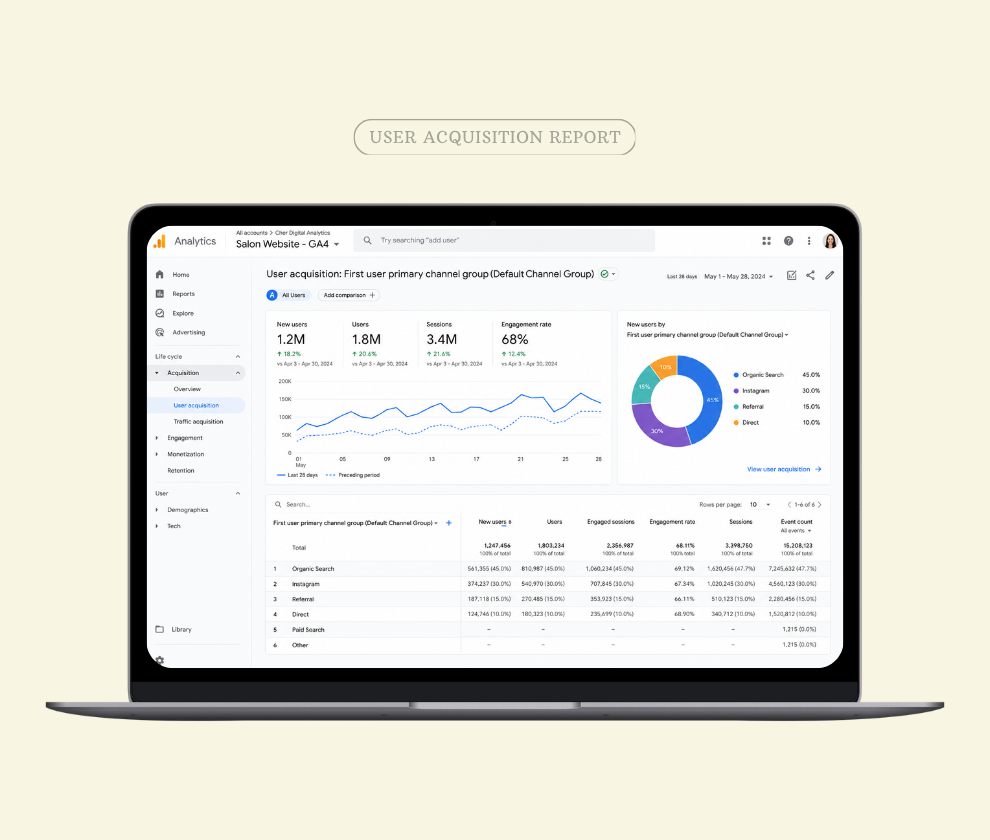
This report shows you how new clients discover your salon for the very first time.
What it looks like: 45% Google Search ("hair salon near me"), 30% Instagram, 15% local referrals, 10% direct website visits.
The takeaway: This tells you your strongest growth channel so you know where to invest your marketing time and money.
2. Traffic Acquisition Report
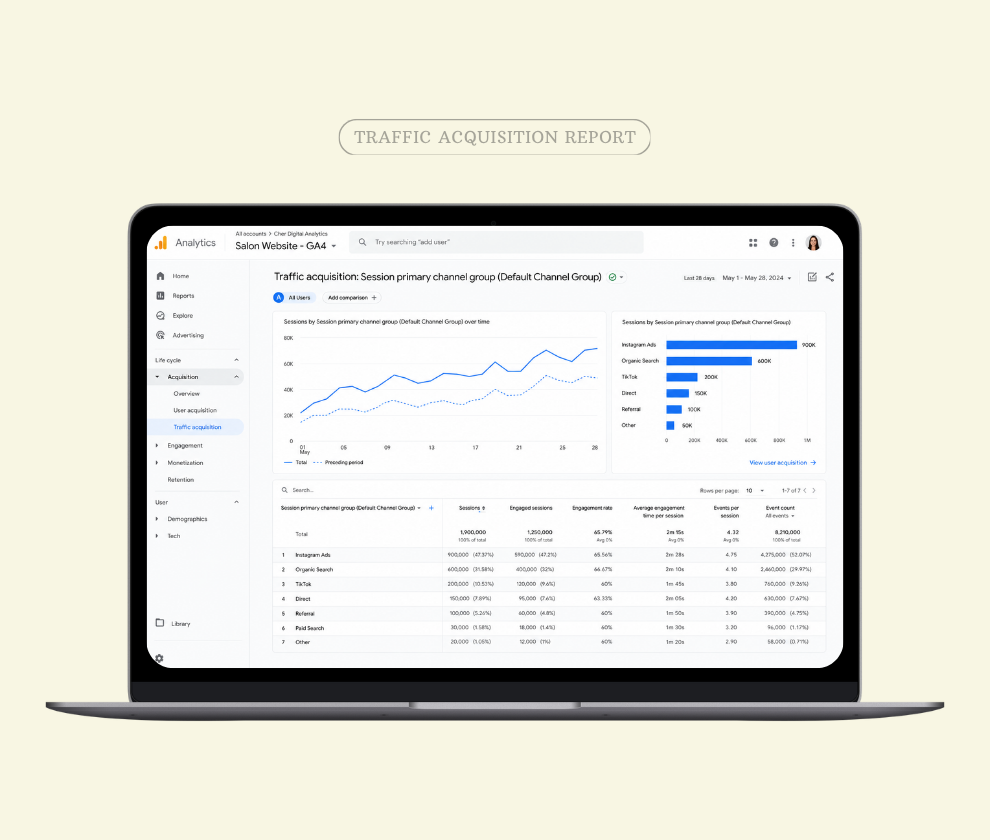
While the first report looks at new users, this shows all visits — including repeat clients.
What it looks like: Instagram ads brought in 900 visits, Google organic search brought in 600 visits, and TikTok brought in 200 visits.
The takeaway: This helps you understand raw traffic volume versus actual performance across your active campaigns.

3. Pages & Screens Report
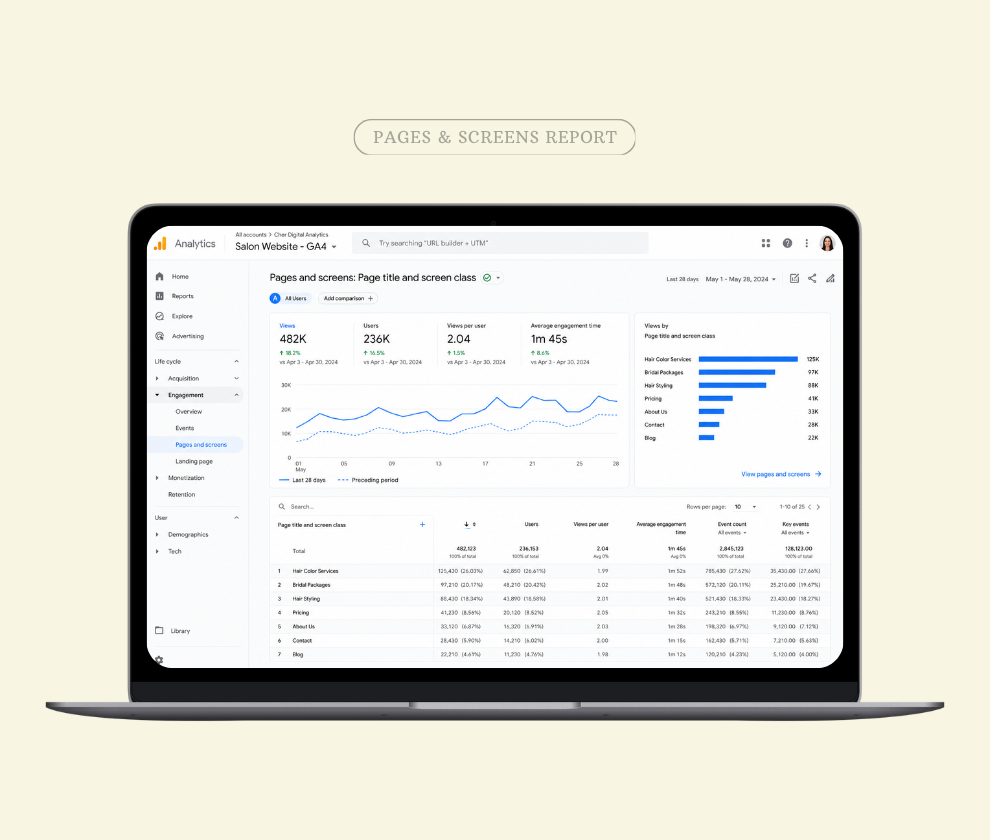
See exactly which pages your clients are spending their time on.
What it looks like: Your hair color page gets the highest views, bridal packages show high interest, but your pricing page sees a massive drop-off.
The takeaway: This reveals what services your clients truly care about — and which pages might need a redesign.
4. Landing Page Report
This shows the very first page a visitor lands on — which isn't always your homepage.
What it looks like: 50% land directly on "Hair Styling," 30% hit the homepage, and 20% land on a seasonal promotions page.
The takeaway: Your first impression is your biggest conversion opportunity. Optimize these specific entry pages to drive bookings.
5. Engagement Overview Report
This measures how actively users interact with your content.
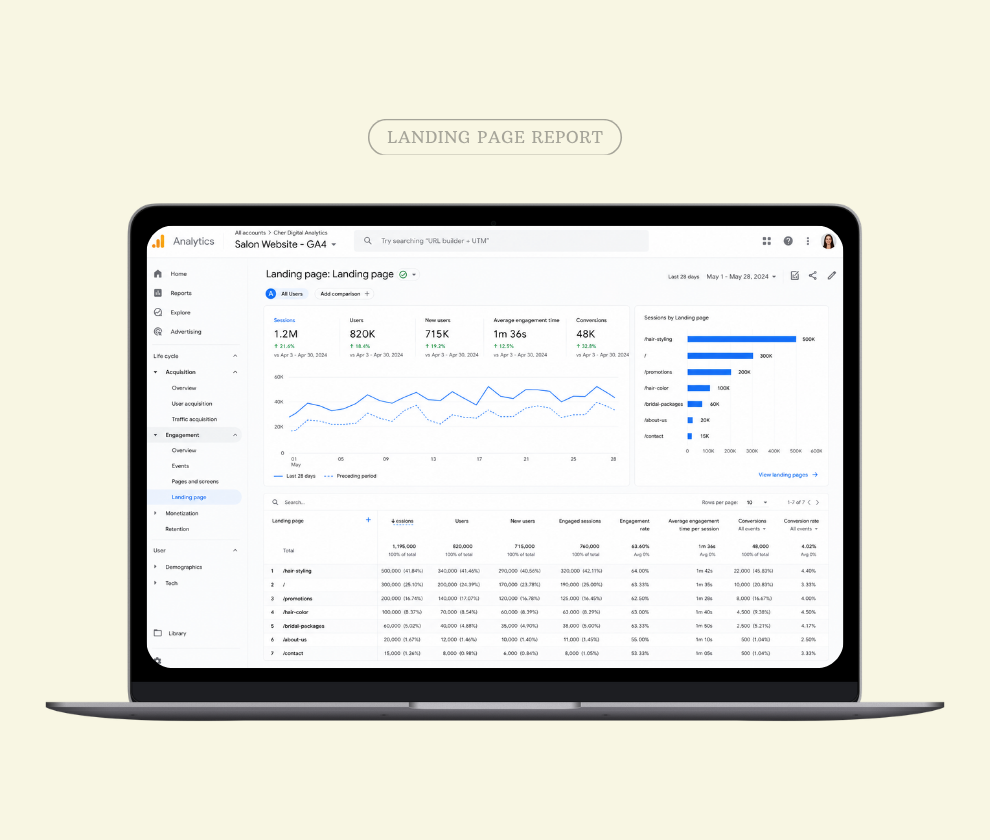
What it looks like: Your average session is 2 minutes and 40 seconds. You see high engagement on bridal services but low engagement on older, outdated pages.
The takeaway: This reflects your content's quality and relevance to your target audience.
6. Events Report
This tracks specific actions and micro-interactions on your site.
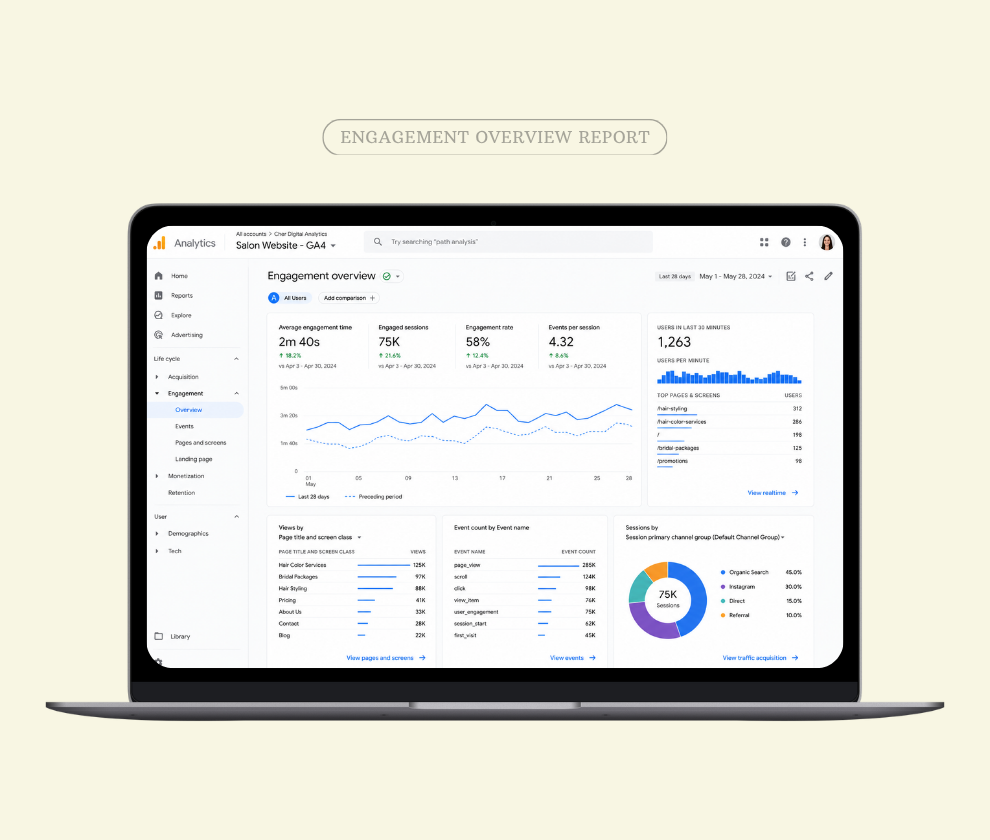
What it looks like: 150 clicks on "Book Appointment," 90 taps on your phone number, and 60 contact form submissions.
The takeaway: This is your intent-tracking layer. It shows you who is actually trying to connect, even if they don't finish booking.

7. Conversion (Key Events) Report
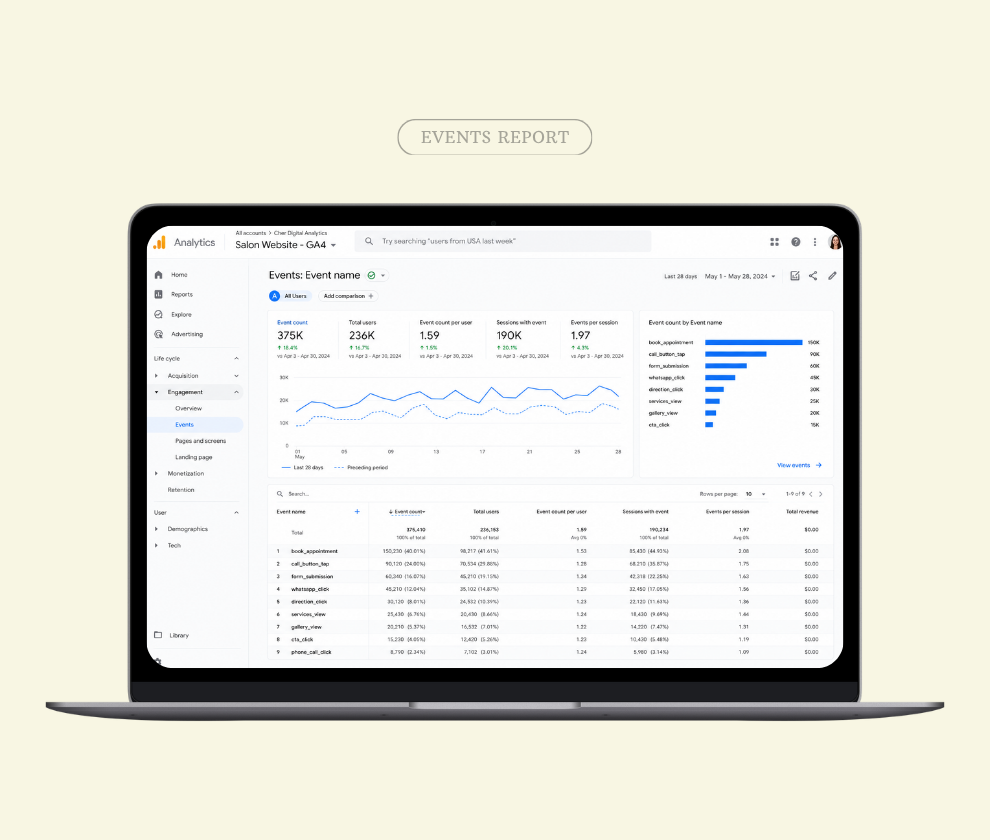
Google recently renamed "Conversions" to "Key Events" in GA4, but the power remains the same. This tracks your actual bookings and leads.
What it looks like: You generated 120 appointments this month. 35% came from Instagram, and 40% came from Google Search.
The takeaway: This is your revenue visibility dashboard. It proves exactly which marketing efforts are paying the bills.
_Report_Graphic.png)

8. Demographics Report
Understand the profile of your ideal client.
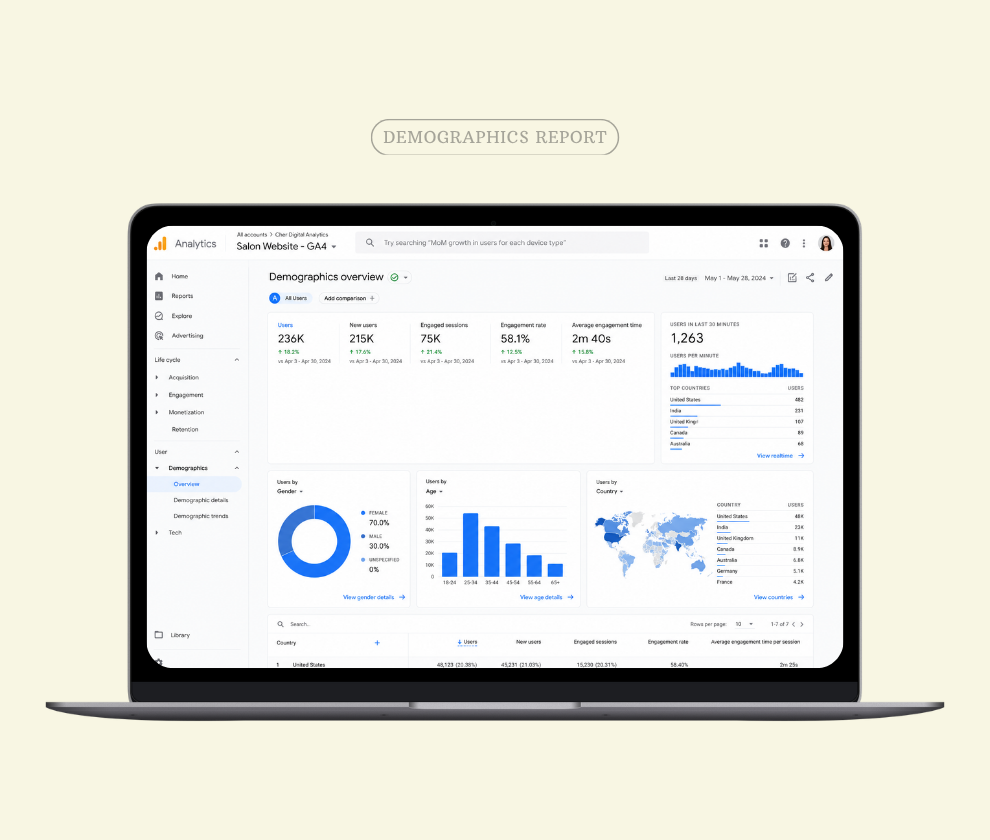
What it looks like: 70% of your visitors are women, aged 25–40, located within 5–10 miles of your salon.
The takeaway: This data is gold for refining your ad targeting, pricing strategies, and service menus.
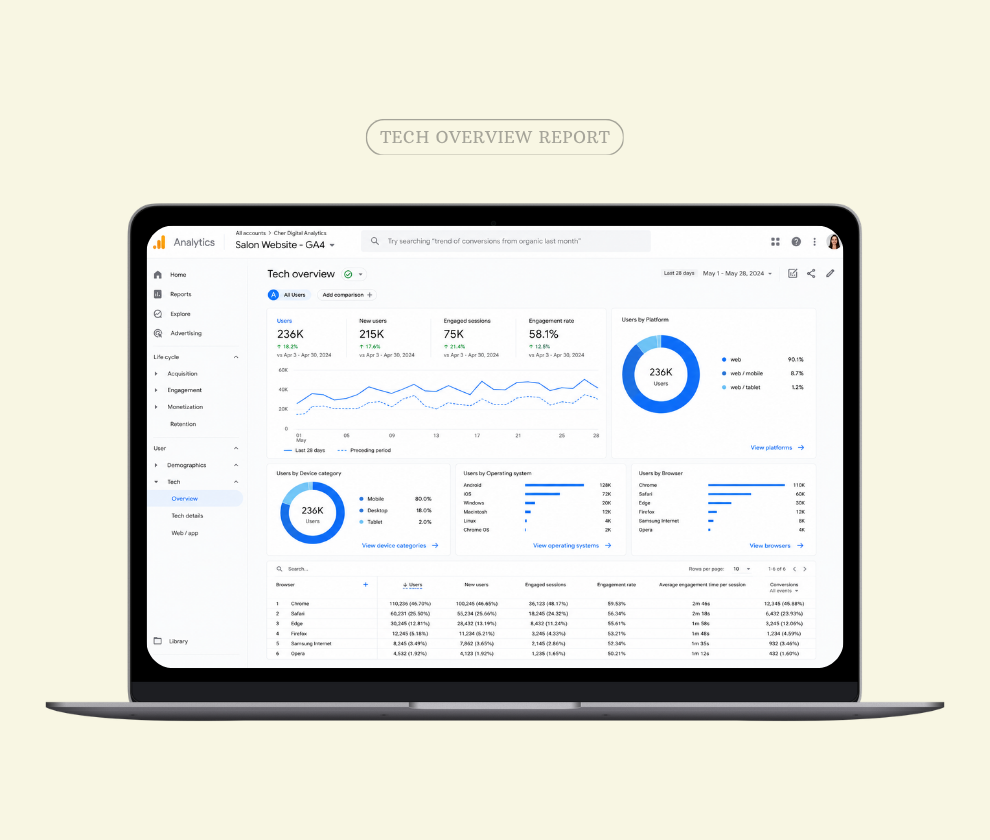
9. Tech Overview Report
Shows what devices your clients are using to browse your site.
What it looks like: 80% are mobile users, and mobile bookings are significantly higher than desktop bookings.
The takeaway: This is critical for mobile optimization. If your booking widget is clunky on a smartphone, this report tells you exactly why you're losing money.

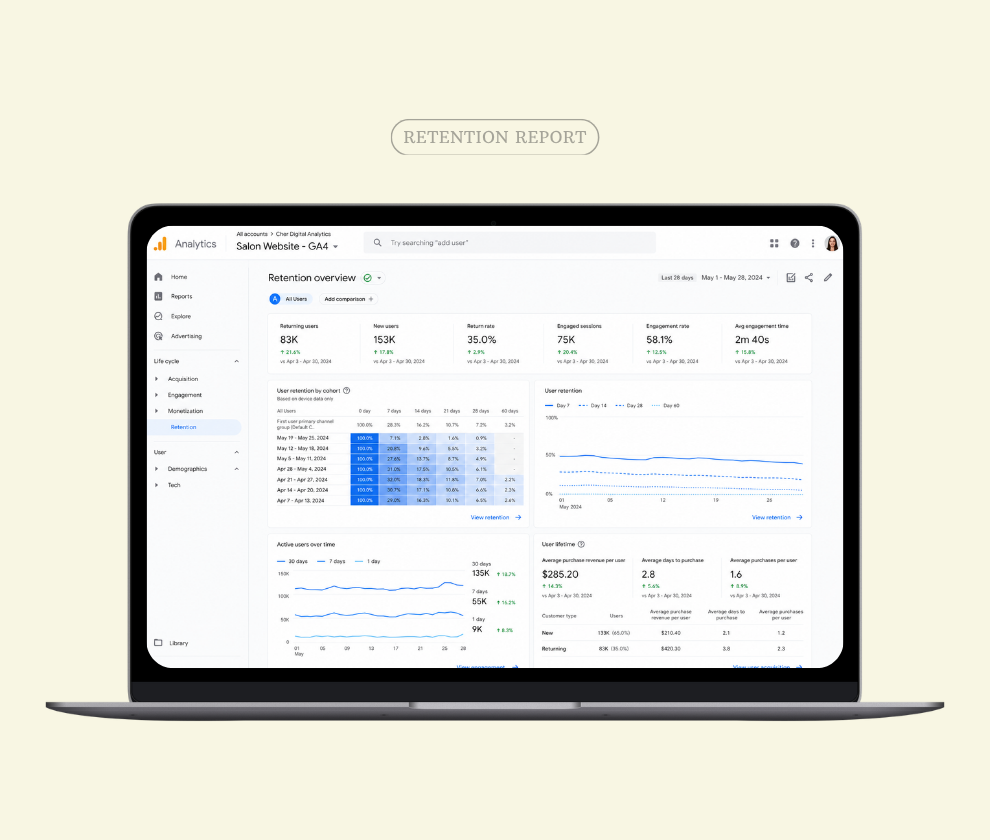
10. Retention Report
This tracks repeat client behavior on your website over time.
What it looks like: 35% of visitors return within 60 days. Users who look at color services have the highest retention, while those looking for discounts rarely return.
The takeaway: This reveals your long-term growth patterns and helps you identify your most loyal, high-value client base.
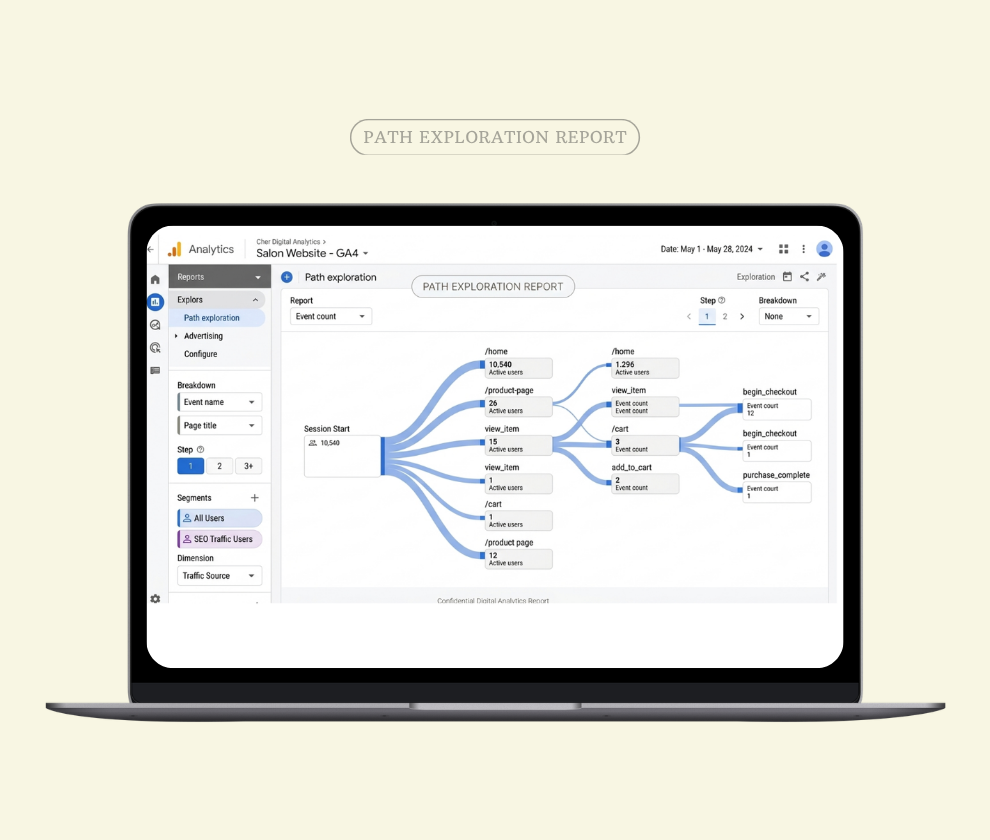
11. Path Exploration Report (bonus insight)
See the exact journey clients take before they decide to book.
What it looks like: Instagram → Website Homepage → Pricing Page → Booking Page.
The takeaway: Mapping this out helps you streamline the conversion pathway, removing friction so more people book.
12. Funnel Exploration Report (bonus insight)
Track exactly where clients drop off before completing a booking.
What it looks like: 500 visits → 200 view services → 80 click booking → 40 actually complete the booking.
The takeaway: This shows you exactly where the "leaks" are in your website, allowing you to patch them and capture lost revenue.
.png)
With analytics, you grow with clarity. ✨
Here's the catch: GA4 does not track things like "Book Now" clicks or specific form submissions out of the box. Getting these insights requires setting up custom tags and events.
These reports may sound complex — but you don't have to figure it out alone.
Get GA4 Set Up Right — Starting at Just $450/Month
Cher Digital Analytics builds the custom tags, tracked events, and dashboards your salon needs to see this data clearly — no guesswork, no missed bookings.
Get Started From $450/MonthFrequently Asked Questions: Google Analytics for Salons
Cher Digital Analytics is your salon growth partner
We handle the heavy lifting so you can focus on your clients.
- Custom GA4 dashboards
- Google Tag Manager tracking
- Booking & click tracking systems
More clients. Less confusion. More clarity.
Get Your Free Salon Audit